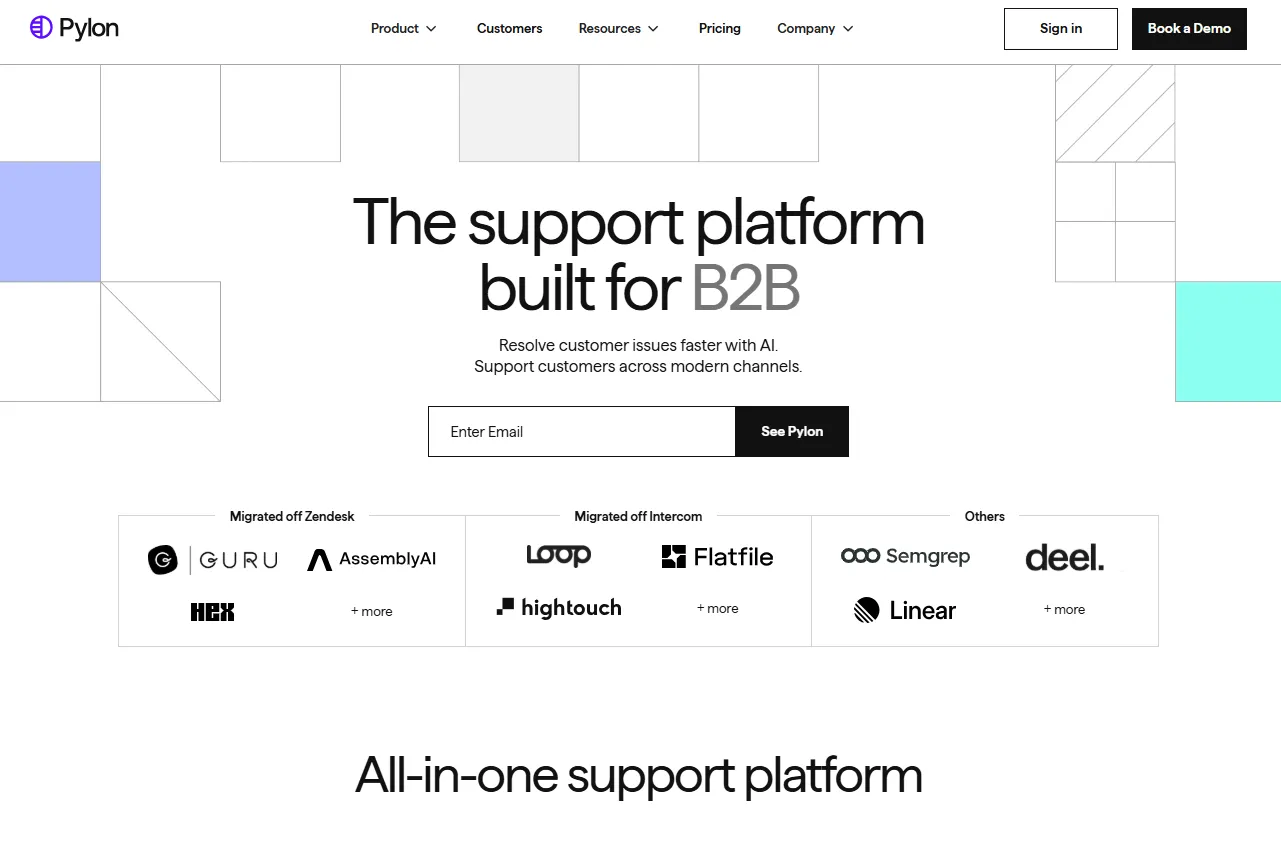
Pylon Overview & 2026 Industry Position
Pylon is an advanced business intelligence and workflow optimization platform purpose-built for modern enterprises that operate at high scale and complexity. In 2026, as organizations navigate AI integration, dynamic compliance needs, and data sprawl across cloud ecosystems, Pylon rises as a synchronizer of these fragmented insights. Offering real-time observability, revenue operations alignment, and transparent metrics, Pylon empowers cross-functional teams to act cohesively—and quickly.
In a market where conventional BI tools fall short in responsiveness and collaboration, Pylon’s platform-centric philosophy allows it to stitch together operational data flows, breaking down silos between RevOps, Product, Finance, and beyond. Whether it’s surfacing early churn predictors or aligning GTM with financial impact, Pylon is positioning itself not merely as a dashboard layer, but as an operational nervous system for growing enterprises in 2026.
From Launch to 2026: Pylon’s Journey
Pylon was founded in 2021 with a mission to replace brittle, spreadsheet-based reporting with dynamic, operational intelligence. The platform debuted in 2022 focusing on early-stage SaaS companies looking for forecasting clarity. By mid-2023, Pylon pivoted to serve scaling B2B and product-led growth orgs, integrating financial modeling with product telemetry. Key milestones include:
- 2021: Pylon founded with emphasis on replacing Google Sheets for RevOps
- 2022: Beta release of operational metrics engine
- Late 2022: Series A funding and integration with Salesforce, Segment
- 2023: Launch of Pylon Templates and Metrics API
- 2024: Added support for consolidated ARR, churn insights, lifecycle reporting
- 2025: Introduced AI-assisted planning and waterfall modeling
Pylon’s 2026 strategy is anchored in becoming the universal layer of operational clarity—one that sits above data tools but below departmental execution layers—to promote scalable, coordinated growth.

Pylon Key Features
Pylon differentiates itself with a feature suite tailored for fast-growth and mid-market tech companies. Here’s what makes it stand out in 2026:
- Metrics Engine: Pre-built metrics like net ARR, ACV, churn, CAC, and COGS configured within a no-code interface.
- Templates: Plug-and-play dashboards for SaaS segmentation, top-funnel growth, customer ROI, and LTV tail analysis.
- Modular Data Modeling: Connects P&L concepts directly to Salesforce, Segment, Stripe, and more without SQL.
- Workflow Bridge: Translate strategy into execution with alerts, comments, and workflow triggers inside dashboards.
- Forecasting & Scenarios: Dynamic top-down and bottoms-up forecasting including waterfall planning models.
- Lifecycle Views: Native capabilities to track historical cohort expansion, churn timing, and renewal patterns.
Workflow & UX
At its core, Pylon is designed to make analytical insight a daily operating muscle for cross-functional teams—not just analysts. The UX is guided by simplicity and automation:
- Drag-and-drop metrics customization without scripting
- Interactive drill-downs on key KPIs and period comparisons
- Slack and email alerting when data breaches thresholds
- Built-in comments and team notes for context-rich dashboards
For executives, the experience is “BI without friction”—decision-grade insights in real time. For ops teams, it’s a centralized system of truth built to flex and evolve with GTM structure changes.
Pylon Pricing Analysis & Value Metrics
As of July 2026, Pylon operates on a modular pricing model based on company size and data complexity. Here’s the breakdown:
| Plan | Monthly Price | Highlights |
|---|---|---|
| Growth | $1,500 | Up to 50 employees, 4 integrations, 5 templates |
| Scale | $3,000 | Up to 200 headcount, all integrations, 12 templates |
| Enterprise | Custom | Unlimited headcount/fields, priority support, AI forecasting |
Value Threshold: Companies with $5M–$100M ARR benefit most through Pylon’s ROI visibility mechanics. The Scale tier provides maximum forecasting + product-revenue integration at a predictable cost.
Pro Tip: The Scale plan unlocks consolidated enterprise metrics and historical data retention—worth it if you operate multiple revenue streams or multi-product lines.
Competitive Landscape
| Provider | Strengths | Ideal Users |
|---|---|---|
| Pylon | Workflow-embedded forecasting, native GTM metrics | Mid-market SaaS, PLG orgs, RevOps-centric teams |
| Looker | SQL-backed custom dashboards, flexible visuals | Data teams, analyst-heavy orgs |
| Cascade | Goal-tracking and OKR frameworks | Strategy and people ops leaders |
| Domo | All-in-one data lakes + BI layers | Enterprises with complex data infrastructures |
Common Use Cases
- PLG SaaS: Understand funnel drop-off, expansion over time, stage-by-stage CAC.
- RevOps Teams: Align GTM with profit models; detect churn, ACV shifts early.
- Founders/CFOs: Translate Board-ready metrics without Excel.
- Multi-product Startups: Forecast blended top-line forecasts and cost per Milestone.
Integrations Ecosystem
Pylon’s strength lies in its plug-and-play integrations with SaaS tools across revenue stacks:
- CRM: Native Salesforce and HubSpot pipelines
- Product Analytics: Segment, Mixpanel support
- Payments: Stripe mapping to ARR/ACV
- Finance: QuickBooks, NetSuite (in beta)
- Collaboration: Slack alerts and Notion embeds
By sending and receiving data from these critical systems, Pylon eliminates data model duplication and fragility—making metrics consistent across every board deck and growth plan.
Pros & Cons
- Pros: Modern, modular metrics stack; integrates with core SaaS tools; non-technical dashboard editing; proactive alerts.
- Cons: Requires upfront configuration; limited Excel export formatting; Slack-based notifications only (for now).
Final Thoughts
For SaaS operators, revenue leaders, or finance stakeholders struggling to align teams around clean, actionable metrics, Pylon dashboards and templates accelerate time-to-insight. Mid-market companies seeking to graduate from Looker/Sheets hybrid chaos will appreciate Pylon’s pre-structured modeling. However, teams with deep data racks or SQL-native cultures may prefer more open-ended tools.
Ultimately, Pylon empowers operational clarity at speed—an irreplaceable advantage in 2026’s agile environments.
Pylon FAQ
Pylon is both: it overlays BI-style visualization on top of pre-modeled revops metrics, blending operational reporting with forecasting capabilities.
Yes. Pylon is no-code by design. Most implementations can be configured by finance, ops, or strategy teams without dev involvement.
Unlike SQL-first platforms, Pylon is metrics-first with out-of-the-box modeling for SaaS KPIs, workflows, and forecasting scenarios tailored to midmarket GTM teams.
Yes. Pylon supports multi-entity, multi-currency reporting and consolidations, including ARR normalization across geographies.
Typical implementations take 2–4 weeks, including alignment on metrics definitions, data connection, and dashboard deployment.

