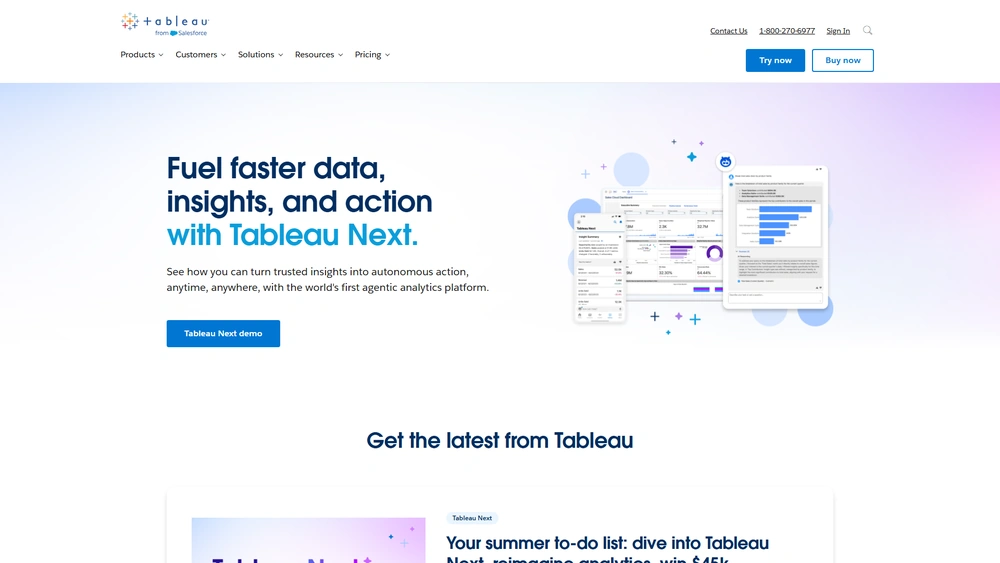
Tableau Overview & 2026 Industry Position
Tableau has long been recognized as a leader in visual analytics, offering powerful solutions for data visualization, BI reporting, and enterprise decision-making. Now, as we move through 2025, the platform extends its legacy with a pivot toward smarter, AI-augmented storytelling, tighter Salesforce integration, and accessible tools for both data specialists and general business users. Tableau thrives in a rapidly expanding analytics market, driven by surging demand for real-time insights and enterprise-wide data democratization.
From Launch to 2026 Journey
Founded in 2003 out of Stanford University, Tableau set out to change how people made sense of raw data. Major milestones include:
- 2008 – Launch of Tableau Public, broadening access to visualization tools.
- 2013 – IPO on the NYSE; an early signal of the rising importance of analytics platforms.
- 2019 – Acquired by Salesforce for $15.7 billion, signaling integration into one of the world’s largest CRM ecosystems.
- 2022 – Tableau Cloud becomes the primary deployment focus, emphasizing SaaS readiness.
- 2024 – Launch of Tableau Pulse, empowering real-time alerting and anomaly detection across enterprise data landscapes.
Now in 2026, Tableau’s strategy centers around unified data experiences with an AI-first approach, further embedding analytics into enterprise workflows and citizen-developer contexts.

Tableau Key Features
Tableau’s strength lies in bridging complexity with usability — here are the standout capabilities as of 2026:
- VizQL-powered Dashboards: Drag-and-drop visual experiences built on robust query performance.
- Tableau Pulse: AI-driven alerts and real-time monitoring across all Tableau views.
- Advanced Forecasting: Predictive analytics fueled by Einstein Discovery and ML algorithms.
- Tableau Public Revamped: Enhanced sharing and embeddability for data storytelling.
- Ask Data + Explain Data: Natural language querying and AI explanations for spike/trend causes.
- Hyper In-Memory Engine: Agile, columnar storage for fast query throughput at scale.
Workflow & UX
Tableau’s 2025 UX philosophy centers around intuitive data interactions — with clean layouts, responsive controls, and guided analytics flows. Recent UX enhancements include:
- Dynamic zone visibility and layout containers for responsive UI design.
- Deep Salesforce workspace embedding — opening Tableau inside Slack, Customer 360, or Reports.
- Simplified publish-to-Web and mobile performance optimizations.
Pro Tip: Pin your most important metrics with Tableau Pulse to receive real-time Slack or Teams updates when thresholds are crossed or anomalies detected.
Tableau Pricing Analysis & Value Metrics
As of July 2026, Tableau offers three license types, each with distinct capabilities:
| Plan | User Type | Monthly Cost | Key Features |
|---|---|---|---|
| Viewer | Read-only | $15/user | Dashboard access, mobile view, Slack notify |
| Explorer | Light creator | $42/user | Ad-hoc analysis, saved views, browser authoring |
| Creator | Full author | $70/user | Dashboard building, data prep, ML modeling |
Overall value is high for mid-to-large organizations seeking robust self-serve analytics. Explorers unlock the platform’s depth without a steep cost increase, while Creators benefit from full integration with Salesforce Einstein capabilities.
Competitive Landscape
| Platform | Strength | Weakness | Best For |
|---|---|---|---|
| Power BI | Deep Microsoft integration | UI complexity | Microsoft-centric teams |
| Looker | Semantic modeling | Less intuitive visuals | Data engineering teams |
| Tableau Creator | Visual depth, AI tools | Higher cost | Medium-large enterprise |
Common Use Cases
- Healthcare operations monitoring via predictive dashboards.
- Sales performance and churn forecasting in SaaS firms.
- Retail inventory optimization using demand trends.
- Governments visualizing civic data for transparency.
- Supply chains monitoring KPIs across divisions and geos.
Tableau Integrations
Tableau works fluidly with over 75 third-party systems, including:
- Salesforce CRM: Native dashboards and report embedding.
- Google BigQuery: Direct SQL connections and refresh strategies.
- Snowflake & Redshift: Fast connectors with governance options.
- Slack: Embedded alerts, Pulse notifications, and Viz previews.
- ServiceNow, Jira, Shopify, SAP: Dashboard-ready connectors.
Tableau Pros & Cons
- Pros:
- Market-leading visuals with interactive depth
- AI-powered insights via Pulse and Explain Data
- Salesforce-native workflows and SSO
- Flexible deployment: Cloud, Server, Desktop
- Cons:
- Steeper learning curve than Power BI
- Premium pricing for Creators
- Limited native ETL capabilities vs competitors
Final Thoughts
Tableau remains a pillar in enterprise analytics, best suited for organizations that value insightful visual storytelling and integrated AI tools. While pricing may deter budget-constrained teams, the return on investment for medium to large enterprises is notable. Tableau Explorer and Pulse features bring much-needed value for operations and team leads, while Creators unlock the full spectrum of embedded and modeled insights.
Tableau FAQ
Tableau Pulse is a real-time alerting system that uses AI to notify users of anomalies, trend shifts, or key metric changes in Slack, email, or dashboards.
While Tableau is enterprise-ready, small to mid-sized businesses can benefit through the Explorer tier or Tableau Public for lighter use cases.
Yes, Tableau integrates seamlessly with Excel files, enabling drag-and-drop visualization on spreadsheets and formulas.
Power BI is tightly integrated with Microsoft Office and lower in cost; Tableau offers superior visuals and AI capabilities but has a steeper learning curve.
Tableau uses AI to generate natural language explanations, detect metric shifts, suggest visualization types, and alert users of anomalies via Tableau Pulse.

